Utilization report
The utilization report shows on how many of the expected days each vehicle was used, as a percentage. It sorts your vehicles into actively used, underutilized and not used.
Use it to find vehicles you could sell or share, or to check that the fleet is used evenly.
What is in the report
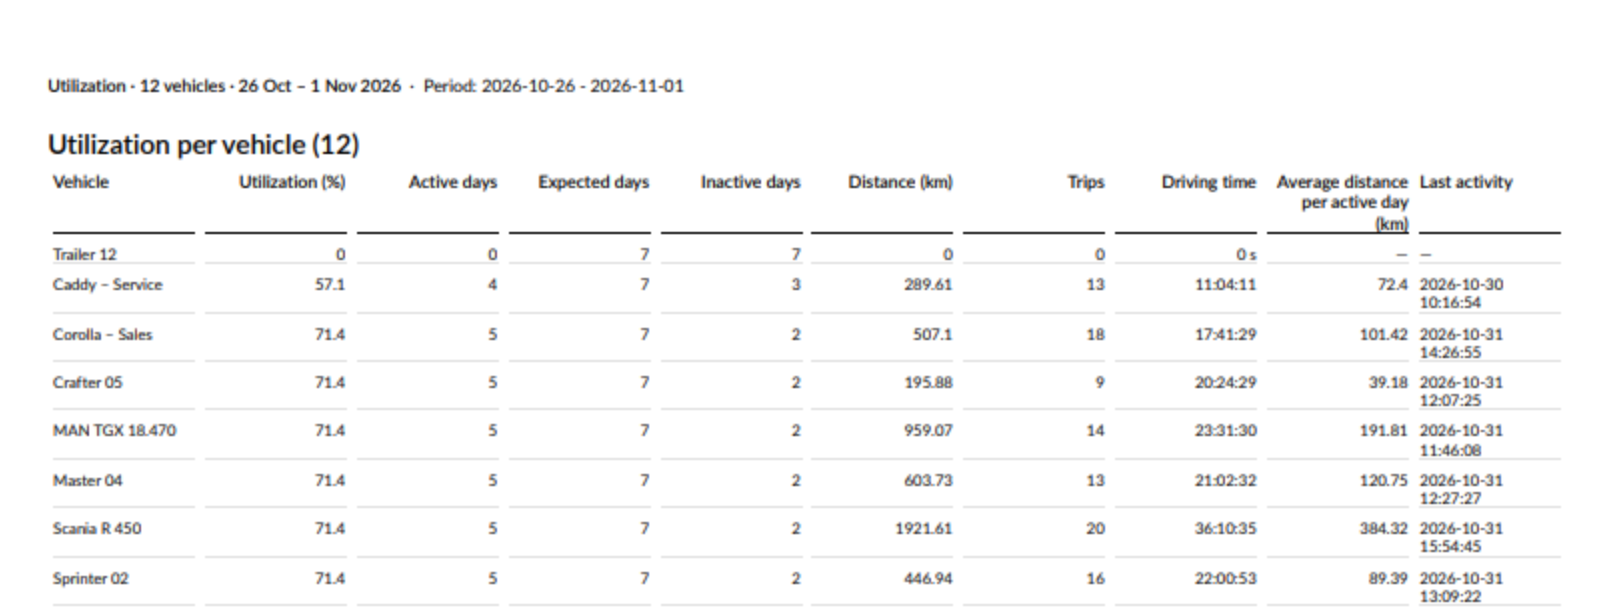
One row is one vehicle, with its figures for the whole period. Every vehicle you chose gets a row, also the ones that did not drive.
The report covers whole days in the report’s time zone. You pick dates, not times, in the When step.
Expected days are the days a vehicle could be used: every day of the period, or only Monday to Friday. Days that have not started yet are not counted. Today counts as soon as it starts.
An active day is an expected day with at least one trip. A trip counts on the day it started.
Utilization is the share of the expected days the vehicle was used. A vehicle that drove on 6 of 7 days has 85.7 %.
Each vehicle is classified:
Actively used– utilization at or above the Underutilized below (%) setting.Underutilized– utilization below that setting, but at least one active day.Not used– no active days at all.
Every vehicle gets the same expected days, also a vehicle that was added in the middle of the period.
Settings
For the utilization report the third step is called Settings. It has no filters, so every vehicle you chose is in the report.
Utilization settings
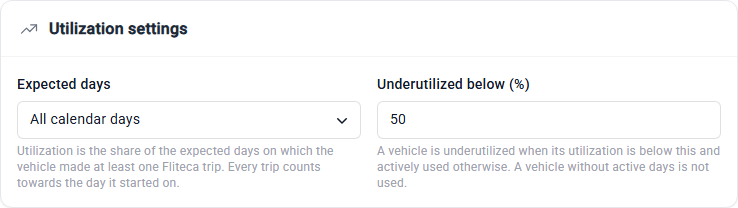
Expected days:
All calendar days – every day counts. This is the default.
Monday to Friday – only weekdays count. Trips made at the weekend are left out of every figure, including the distance, trips and driving time.
Underutilized below (%) – a vehicle with a lower utilization is
Underutilized, otherwiseActively used. A whole number from 1 to 100,50at first. It does not remove any vehicles from the report.
Vehicle order
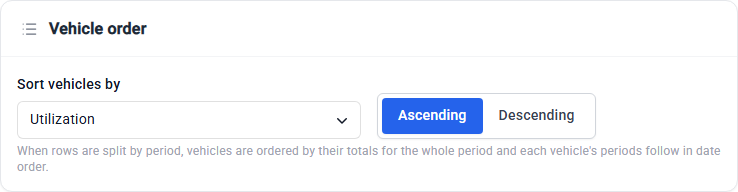
Sort vehicles by Utilization, Vehicle name, Active days, Distance, Trips or Driving time, Ascending or Descending. At first the least used vehicle comes first.
When the rows are split by period, each vehicle’s rows stay together in date order, and the vehicles are sorted by their totals for the whole period.
Columns
Columns marked ✓ are in the report by default. The vehicle columns can be added too. All figures count only the expected days.
Column |
What it shows |
Default |
|---|---|---|
Utilization (%) |
Active days divided by expected days, as a percentage |
✓ |
Active days |
Expected days with at least one trip |
✓ |
Expected days |
The days the vehicle could be used, as set in Expected days |
✓ |
Inactive days |
Expected days without trips |
✓ |
Distance (km) |
How far the vehicle drove on its finished trips |
✓ |
Trips |
The number of trips |
✓ |
Driving time |
The time spent on trips. A trip still going on counts until the end of the period or until the report was made. |
✓ |
Average distance per active day (km) |
How far the vehicle drove on average on the days it was used. Empty for a vehicle without active days. |
✓ |
Last activity |
When the last trip ended, or the time the report was made while it is still going on |
✓ |
Utilization classification |
|
|
Days since last activity |
How many days have passed since the vehicle was last used, up to the end of the period or today. |
|
Period |
The days the row covers: the whole period, or one day, week or month when the rows are split |
|
First activity |
When the first trip started |
|
Stop time |
The time the vehicle stood parked during its working days, between the first and the last trip of each day |
|
Engine idle time |
The time the vehicle stood still with the engine running. Waits shorter than 3 minutes, such as at traffic lights, are not counted. |
|
Average trips per active day and Average driving time per active day |
The trips and the driving time on average on the days the vehicle was used |
|
Max daily distance (km) |
The longest distance driven in one day |
|
Average daily distance (km) |
How far the vehicle drove per expected day, counting the expected days it did not drive |
Summary
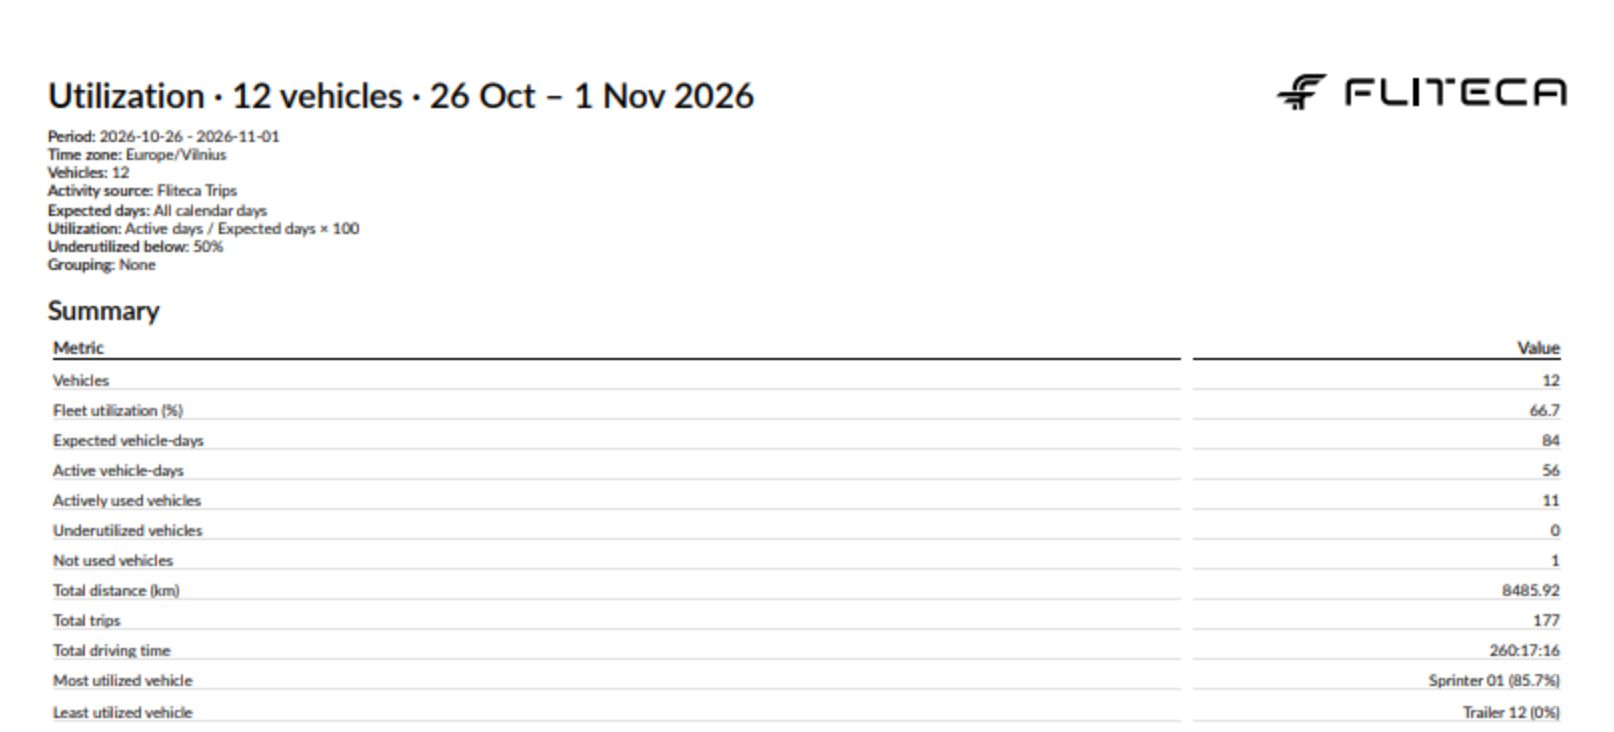
Every utilization report starts with these figures:
Figure |
What it is |
|---|---|
Vehicles |
The number of vehicles in the report |
Fleet utilization (%) |
How much of the fleet’s available time was used: the share of all expected vehicle-days with a trip |
Expected vehicle-days and Active vehicle-days |
The expected and the active days of all vehicles added up. 12 vehicles over 7 days make 84 expected vehicle-days. |
Actively used vehicles, Underutilized vehicles and Not used vehicles |
How many vehicles are in each class |
Total distance (km), Total trips and Total driving time |
The sums of all vehicles |
Most utilized vehicle |
The vehicle with the highest utilization, for example |
Least utilized vehicle |
The vehicle with the lowest utilization, for example |
In the Summary step, the first choice is One row per vehicle. Click Add a summary table to change the list or add tables:
Split each row by Day, Week or Month gives every vehicle a row for each period, so you see its utilization week by week. The Period column is added at the front so you can tell the rows apart.
A row for each Vehicle group adds a table with the utilization of each group. Vehicle alone adds no table, because every vehicle already has its own row.
Summary tables show Vehicles, Utilization (%), Active days, Expected days, Distance (km), Trips and Driving time. See the Summary step.
Example
A utilization report for one week, with the default settings. Click a picture to see it full size.
Good to know
With Monday to Friday, a vehicle that only drives at weekends shows as
Not used.A report for This month made in the morning counts today as an expected day, and most vehicles have not driven yet. Make it at the end of the day, or pick the dates up to yesterday.
A vehicle added in the middle of the period has the same expected days as the others, so it looks less used than it was.
Public holidays count as expected days.