Create a report
Click Reports in the top menu, then New report. Every report is set up in the same seven steps. The steps are on the left, and the box under them shows what you chose so far.
The steps at a glance
Report type – click a type, and choose Once or On a schedule.
Data – tick the vehicles or vehicle groups, and for some types the geo-zones.
Filters – choose which rows to keep and in what order. Every type has its own filters.
When – pick the period, for example Last 7 days, and check the time zone.
Columns – choose the columns and drag them into order.
Summary – optional. Add tables with totals for each vehicle, group, day, week or month.
Output and delivery – choose PDF, XLSX or CSV, the name, and who gets the file by email.
Click Generate. Fliteca makes the report in the background and notifies you as soon as it is ready. Every step is explained below.
1. Report type
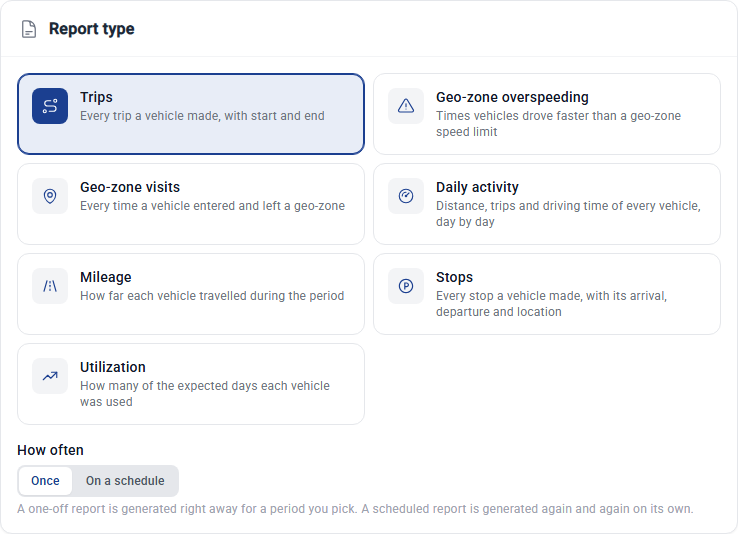
Click the report type. Not sure which one? See Which report do I need?.
How often:
Once makes the report right away for a period you pick, see Single reports.
On a schedule makes it again and again on its own, see Scheduled reports.
Start from a template – click a template to fill every step with its settings. Blank starts from the defaults again. Browse all templates opens the Templates tab. See Templates.
If you change the type after you have set up other steps, Fliteca asks first, because the other steps start over.
The geo-zone reports and the stops report also need geo-zones in your plan and permission to see geo-zones. Without them their cards are greyed out.
2. Data
Choose the vehicles the report is about.
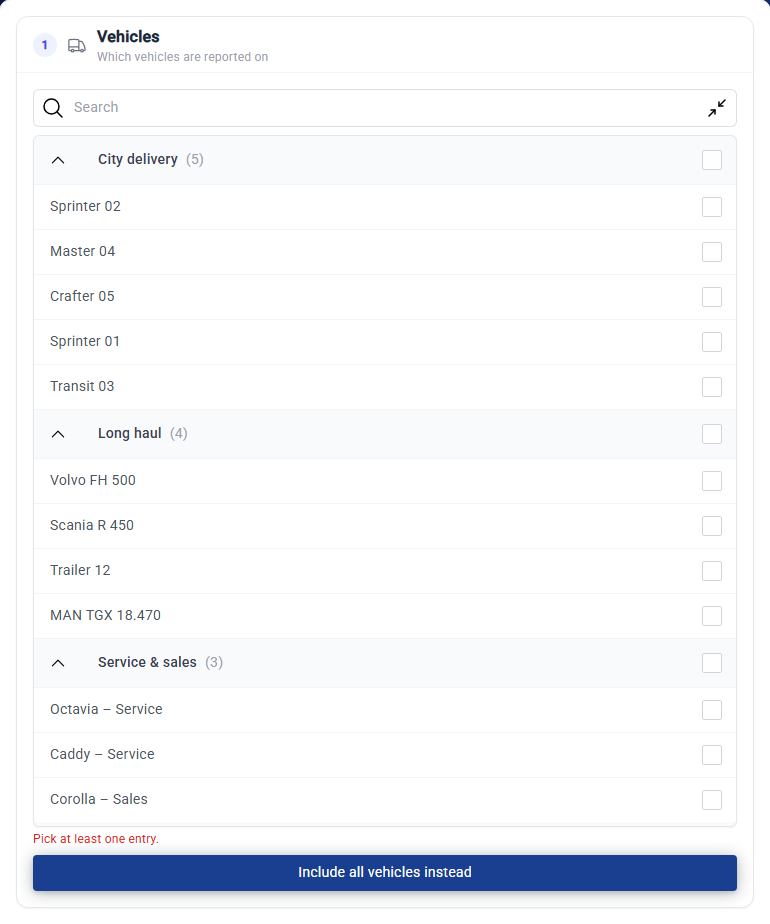
Tick vehicles one by one, or tick a vehicle group. A ticked group also includes vehicles added to it later.
Include all vehicles instead ticks every vehicle you have today. Vehicles you add later are not included, so tick a group if the report should grow with your fleet.
You only see the vehicles you have access to.
The geo-zone visits, geo-zone overspeeding and stops reports also have a Geo-zones column:
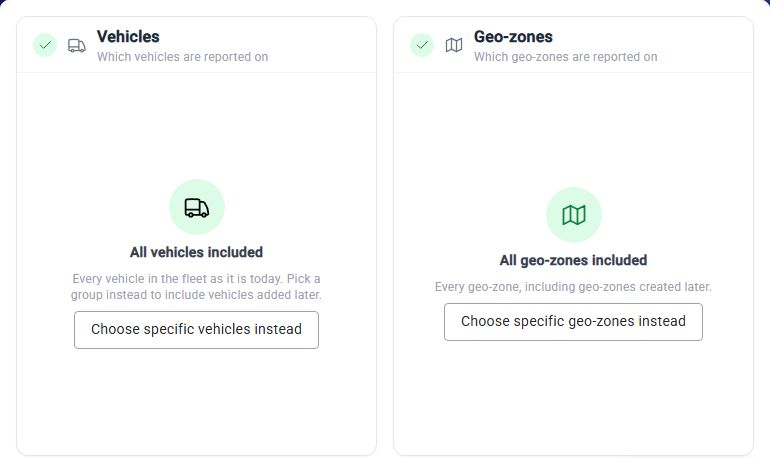
All geo-zones included is the default. It covers every geo-zone, including geo-zones created later.
Click Choose specific geo-zones instead to tick geo-zones or geo-zone groups.
3. Filters
Filters choose which rows are kept and in what order. They are different for every report type:
Utilization – here the step is called Settings
4. When
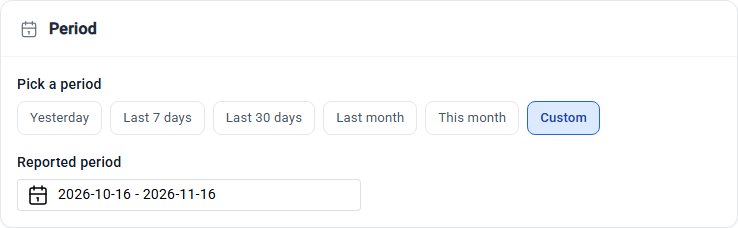
Pick the period the report covers. For a scheduled report this step looks different, see Scheduled reports.
Choice |
Covers |
|---|---|
Today |
Today so far. Only for daily activity, mileage and utilization. |
Yesterday |
All of yesterday |
Last 7 days |
The 7 days before today, and today so far |
Last 30 days |
The 30 days before today, and today so far |
Last month |
The whole previous calendar month |
This month |
From the 1st of this month until now |
Custom |
The dates you set under Reported period |
You can always change the start and the end under Reported period.
The daily activity, mileage and utilization reports count whole days, so you pick dates without times:
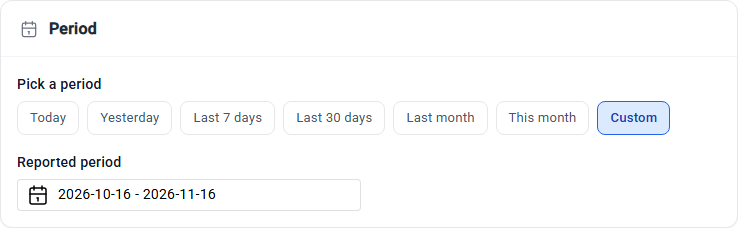
The other reports take exact times, for example from 08:00 to 17:00.
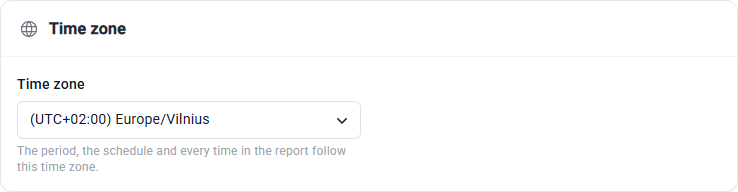
Time zone – the period, the schedule and every time in the report follow this time zone. It starts as your company’s time zone.
5. Columns
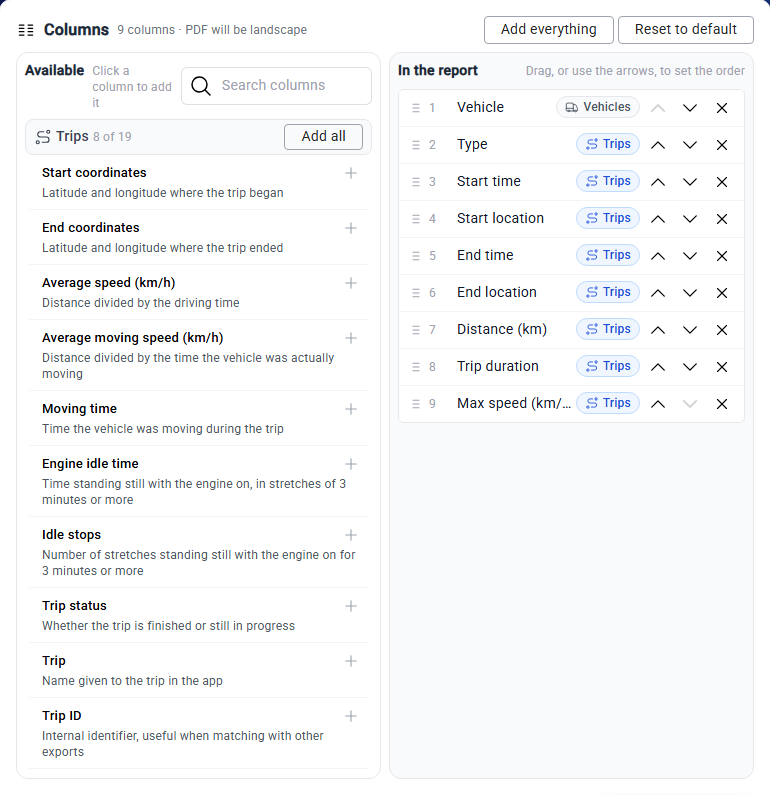
Available on the left lists the columns you can add, in groups: the report’s own columns, Vehicles and, for the geo-zone and stops reports, Geo-zones. Each column has a short description. Type in Search columns to find one.
Click a column to add it at the end. Add all adds a whole group. Add everything adds every column.
In the report on the right is the order of the columns in the file. Drag a column, or use its arrows, to move it. Click its ✕ to remove it.
Reset to default brings back the standard columns of the report type.
A PDF with more than 6 columns is printed on landscape pages.
The columns of each report type are listed on its page. These two groups are the same in every report.
Vehicle columns
Every report has them. The values are the ones the vehicle has when the report is made.
Column |
What it shows |
|---|---|
Vehicle |
The vehicle’s name. In the report by default. |
Vehicle GUID |
A code that stays the same even when you rename the vehicle. Use it to match rows with other exports. |
License plate, Notes 1, Manufacturer, Model, Year, VIN |
The details from the vehicle’s card |
Category |
For example |
Fuel type |
|
Odometer (km) |
The odometer when the report was made |
Vehicle group |
The group the vehicle belongs to |
Geo-zone columns
The geo-zone visits, geo-zone overspeeding and stops reports have them. The values are the ones the geo-zone has when the report is made.
Column |
What it shows |
|---|---|
Geo-zone |
The geo-zone’s name. In the report by default. |
Geo-zone GUID |
A code that stays the same even when you rename the geo-zone. Use it to match rows with other exports. |
Geo-zone description |
The description entered on the geo-zone |
Geo-zone severity |
|
Geo-zone group |
The group the geo-zone belongs to |
Geo-zone enabled |
Whether the geo-zone is switched on |
Geo-zone max speed |
The speed limit set on the geo-zone |
6. Summary
Every report file starts with a Summary table of headline figures, such as the total distance. Each type’s page lists them. This optional step adds more tables, with totals for each vehicle, group, day, week or month.
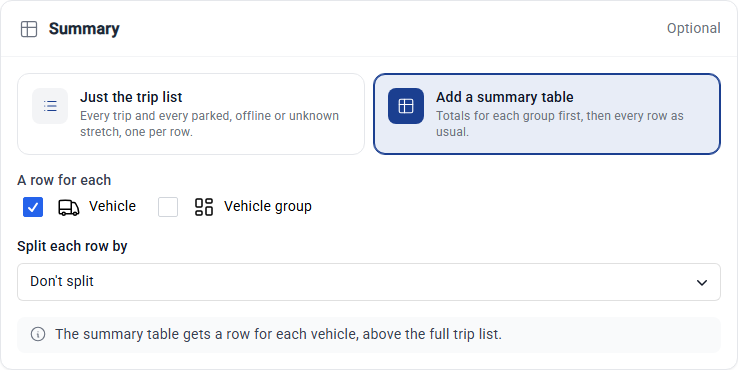
Keep the list only (for example Just the trip list) and click Skip, or click Add a summary table.
A row for each – tick Vehicle, Vehicle group and, for the geo-zone and stops reports, Geo-zone. With two or more ticked, drag them to set the order they nest in.
Split each row by – Don’t split, Day, Week (Monday to Sunday) or Month.
How to combine them – shown when you choose both a row and a split. For example, with a row for each vehicle and a split by week:
Each vehicle, split by week – one table, the weeks under each vehicle
Each week, split by vehicle – one table, the vehicles under each week
By vehicle and by week separately – two tables
The line at the bottom of the card says what the table will look like.
Summary tables come before the full list in the file. They keep their own order: the newest period first, and the groups with the most rows first. For the mileage and utilization reports, a split also splits the vehicle list itself, see their pages.
7. Output and delivery
Format
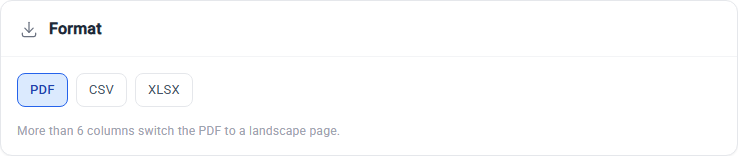
PDF – ready to print or send
XLSX – an Excel workbook, one sheet for each table
CSV – plain text for other software. Choose the CSV separator: comma, semicolon, tab or pipe.
You can get the same report in another format later. Save and download a report shows what each format looks like.
Report name
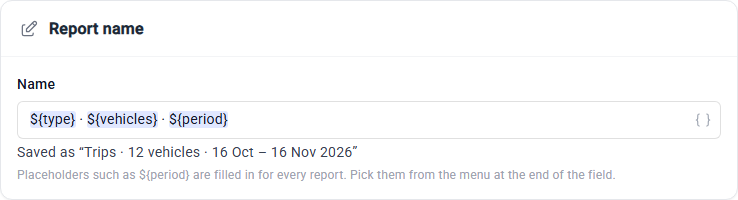
The name is filled in for you. Change it if you like. Placeholders such as ${period} are replaced for every report.
Pick them from the { } menu at the end of the field. The line under the field shows the name the report will get.
Placeholder |
Becomes |
|---|---|
|
The report type, for example |
|
The vehicle or group name when there is only one, otherwise for example |
|
The same for geo-zones, or |
|
The days the report covers, for example |
|
The first and the last day, for example |
|
The week of the first day, for example |
|
The month of the first day, for example |
|
The year of the first day, for example |
Also send by email
You always get a notification in the app when the report is ready. Open Also send by email to email the file too.
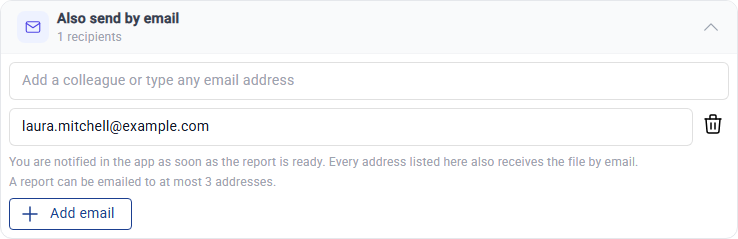
Type a colleague’s name, or any email address, and pick it from the list.
Send to me adds your own address. Add email adds an empty row.
A report can be emailed to at most 3 addresses.
Everyone listed gets an email with the file attached.
Template

Tick Save these settings as a template to make the same report again later with one click, see Templates. The report is made either way.
Click Generate. The report appears on the Generated tab, and Fliteca notifies you when it is ready. See Single reports.