Mileage report
The mileage report shows how far each vehicle drove in the period, with its trips and the days it was used.
Use it for your monthly mileage records, fuel and tax claims, or to see which vehicles drive the most.
What is in the report
One row is one vehicle, with its totals for the whole period. Vehicles that made no trips still get a row with
0km, so the report lists your whole fleet.The report covers whole days in the report’s time zone. You pick dates, not times, in the When step. Days that have not started yet when the report is made are left out.
A trip counts in full on the day it started, so reports for back-to-back periods never count a trip twice. A trip that started before the first day does not count, even when it ended inside the period.
A trip that is still going on has no distance yet. It already counts in Trips and Driving time.
An active day is a day with at least one trip.
To get a row for each vehicle and each day, week or month, use Split each row by in the Summary step. See below.
Settings
The mileage settings are on the Filters step.
Mileage settings
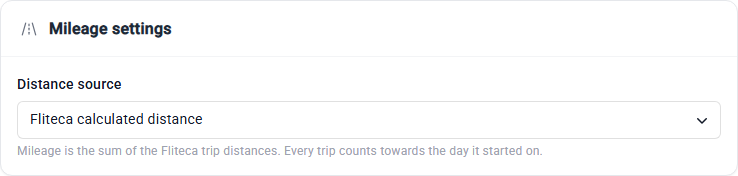
Distance source – where the distances come from. For now the only choice is Fliteca calculated distance: the length of the routes the tracker recorded.
Mileage filters
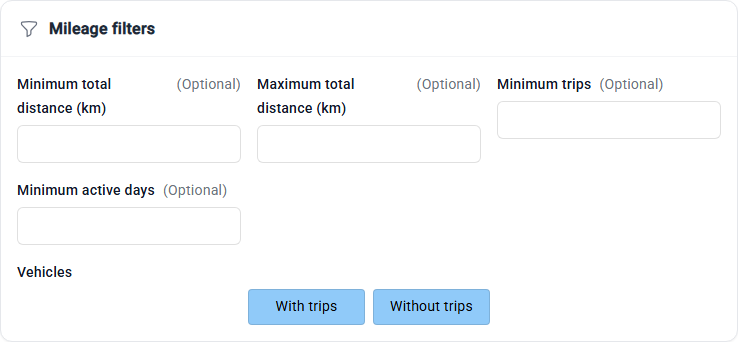
The filters look at each vehicle’s totals for the whole period, also when the rows are split by day, week or month. All of them are empty at first, so every vehicle is kept.
Minimum total distance (km) and Maximum total distance (km) – only keep vehicles that drove this far in total.
Minimum trips – leave out vehicles with fewer trips.
Minimum active days – leave out vehicles that drove on fewer days.
Vehicles – keep vehicles With trips, Without trips or both. Untick Without trips to hide the vehicles that did not drive.
The notes at the top of the report say how many vehicles the filters left out.
Vehicle order
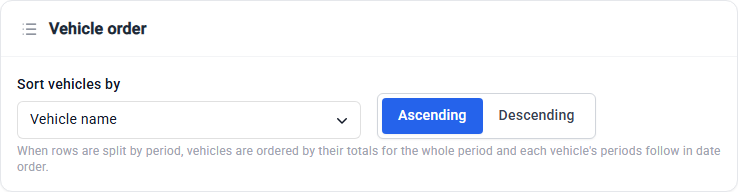
Sort vehicles by Vehicle name, Distance, Trips, Active days or Driving time, Ascending or Descending. At first the vehicles are listed by name, A to Z.
When the rows are split by period, each vehicle’s rows stay together in date order, and the vehicles are sorted by their totals for the whole period.
Columns
Columns marked ✓ are in the report by default. The vehicle columns can be added too.
Column |
What it shows |
Default |
|---|---|---|
Period |
The days the row covers: the whole period, or one day, week or month when the rows are split |
✓ |
Distance (km) |
How far the vehicle drove on its finished trips |
✓ |
Trips |
The number of trips that started in the period |
✓ |
Active days |
The number of days with at least one trip |
✓ |
Average distance per active day (km) |
How far the vehicle drove on average on the days it was used. Empty for a vehicle without trips. |
✓ |
Driving time |
The time spent on trips. A trip still going on counts until the end of the period or until the report was made. |
|
Stop time |
The time the vehicle stood parked during its working days, between the first and the last trip of each day |
|
Engine idle time |
The time the vehicle stood still with the engine running. Waits shorter than 3 minutes, such as at traffic lights, are not counted. |
|
Average trip distance (km), Max trip distance (km) and Min trip distance (km) |
The average, the longest and the shortest distance of one trip |
|
First activity |
When the first trip of the period started |
|
Last activity |
When the last trip of the period ended, or the time the report was made while it is still going on |
|
Max daily distance (km) |
The longest distance driven in one day |
|
Average daily distance (km) |
How far the vehicle drove per day of the period, counting the days it did not drive |
Summary
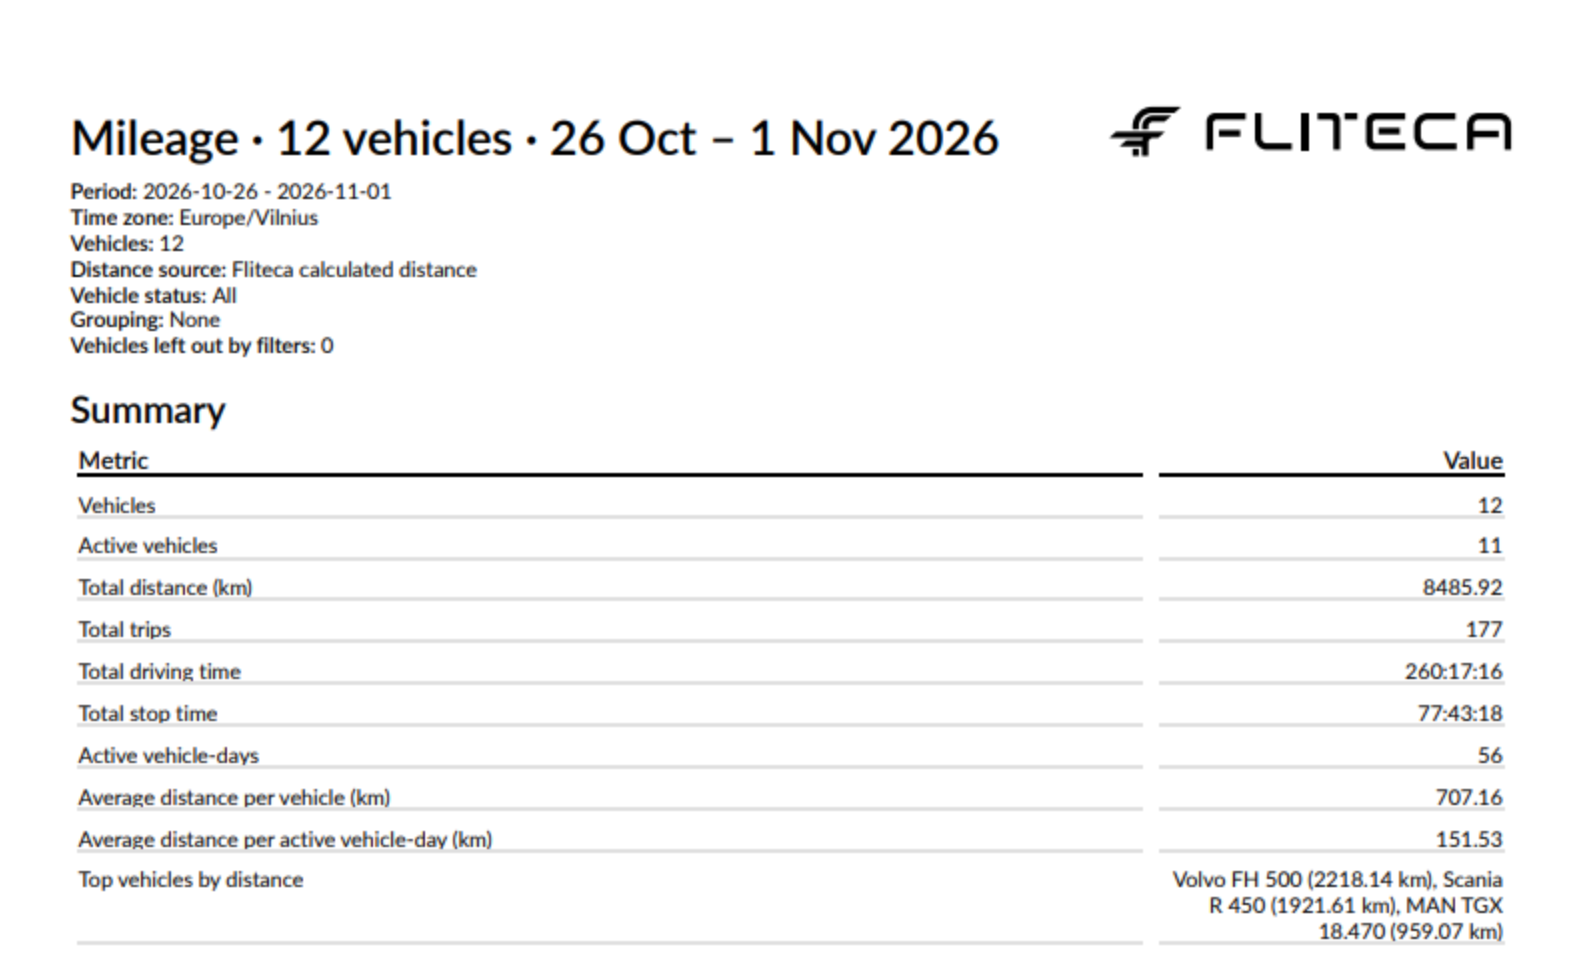
Every mileage report starts with these figures:
Figure |
What it is |
|---|---|
Vehicles |
The number of vehicles in the report |
Active vehicles |
The number of vehicles with at least one trip |
Total distance (km), Total trips, Total driving time and Total stop time |
The sums of all vehicles |
Active vehicle-days |
The active days of all vehicles added up. Two vehicles that both drove on Monday make 2 vehicle-days. |
Average distance per vehicle (km) |
How far a vehicle drove on average, counting the vehicles that did not drive |
Average distance per active vehicle-day (km) |
How far a vehicle drove on average on a day it was used |
Top vehicles by distance |
The three vehicles that drove the most, for example |
In the Summary step, the first choice is One row per vehicle. Click Add a summary table to change the list or add tables:
Split each row by Day, Week or Month gives every vehicle a row for each period, so you see how far it drove each week. The Period column is added at the front so you can tell the rows apart. The first and the last period can be shorter than a whole week or month.
A row for each Vehicle group adds a table with the totals of each group. Vehicle alone adds no table, because every vehicle already has its own row.
Summary tables show Vehicles, Distance (km), Trips, Active days, Driving time and Stop time. See the Summary step.
Example
A mileage report for one week, with the default settings. Click a picture to see it full size.

Good to know
The Period column always shows the full range you picked, also for a one-day report or when the period ends in the future. The figures only cover the days that have started.
A vehicle whose only trip is still going on counts as With trips, but its distance is
0until the trip ends.To see each vehicle’s days one by one, with the first and last activity of each day, use the daily activity report.