Analysis
If configured, some trackers send a lot of additional information to Fliteca which if known by Fliteca is decoded and saved with each entry. If you need to analyze any of the supported IO elements, you can use Analysis section to view data in table view or graphical chart view.
Based on whether you want to analyze data in table or graph format, click Analysis in the top menu and choose Graphical or Table.
Draw a chart
Click Analysis › Graphical.
Click Select and choose a vehicle.
Click the date box and choose a period, for example Last 3 days. Choose Date range with time if you need exact hours.
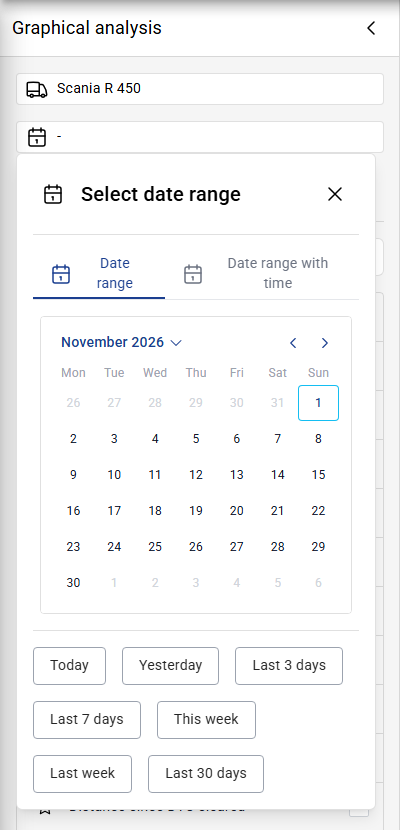
Tick the values you want to see, for example Speed, Ignition status and External voltage. Type in Search to find a value. Click the star to keep a value at the top of the list.
Click Show analysis.
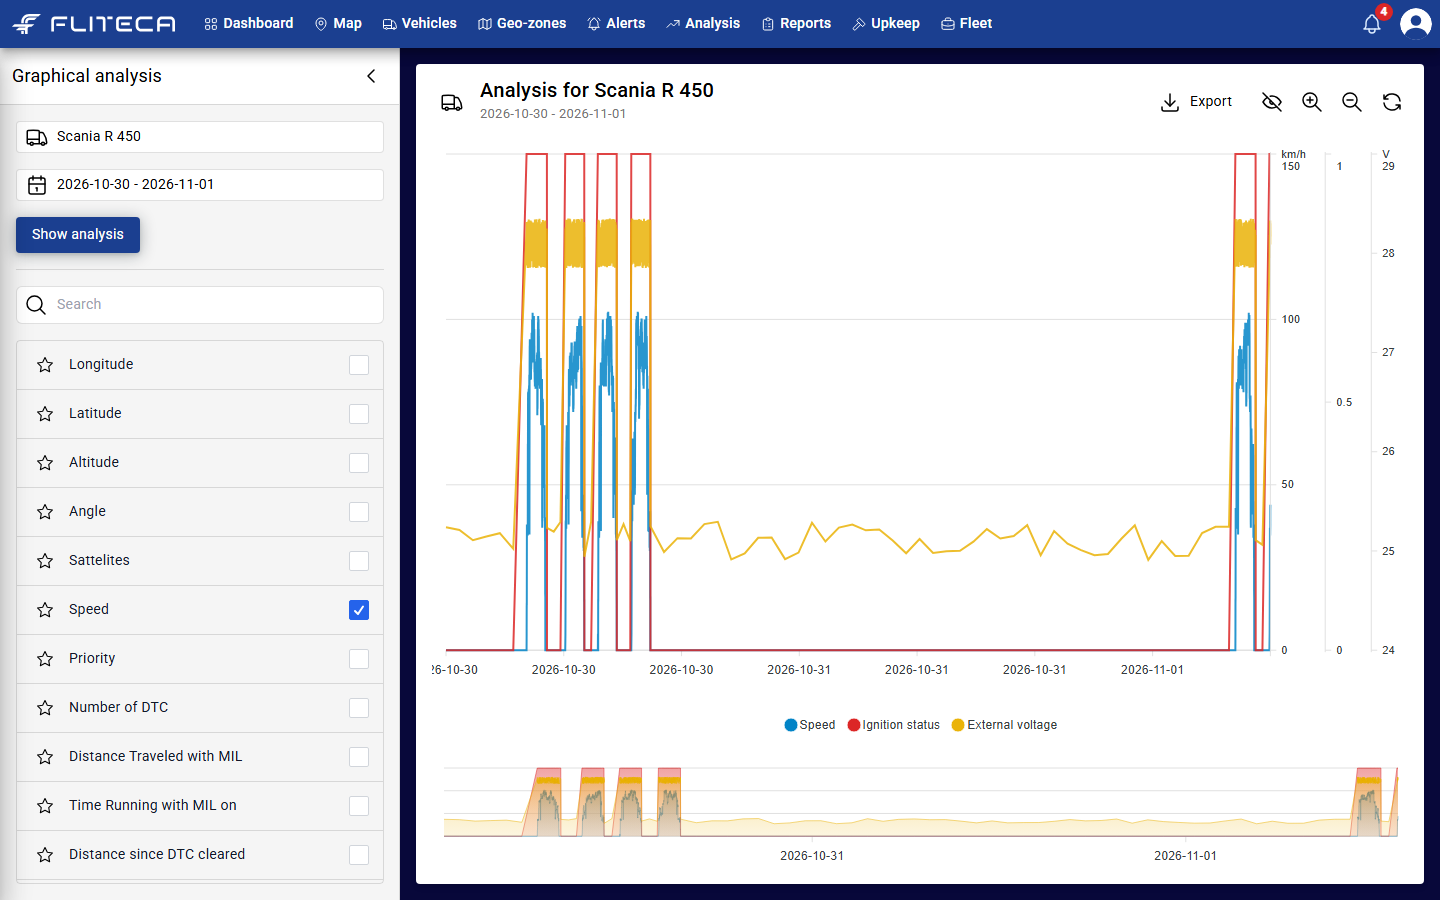
Working with the chart:
Point at the chart to see the exact values at that time.
Drag the handles of the small chart at the bottom to zoom into a part of the period.
Use the buttons in the top-right corner to export, hide all lines, zoom in, zoom out and reload.
Click a name under the chart to hide or show that line.
Tip
Want to know which values your tracker can send and Fliteca is able to understand? See Supported DataTypes from Trackers and check with the manufacturer documentation as it may also be limited by a configuration.
Look at the raw data
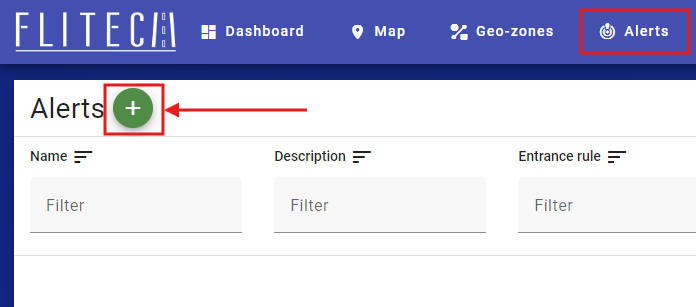
Click Analysis › Table.
Choose the vehicles with All and the period with the date button.
Every row is one message from a tracker. The newest messages are at the top.
Click the funnel to filter by any column.
Click the column button to choose which columns you see. Drag a column header to move it.
Click Export to download the rows.
The blue button reloads the table. The text next to it says when it was last loaded.