Geo-zone overspeeding report
The geo-zone overspeeding report lists every time a vehicle drove faster than the speed limit of a geo-zone: where, when, for how long and how fast.
Use it to find speeding in residential areas, at customer sites or on a motorway stretch you have drawn as a geo-zone.
What is in the report
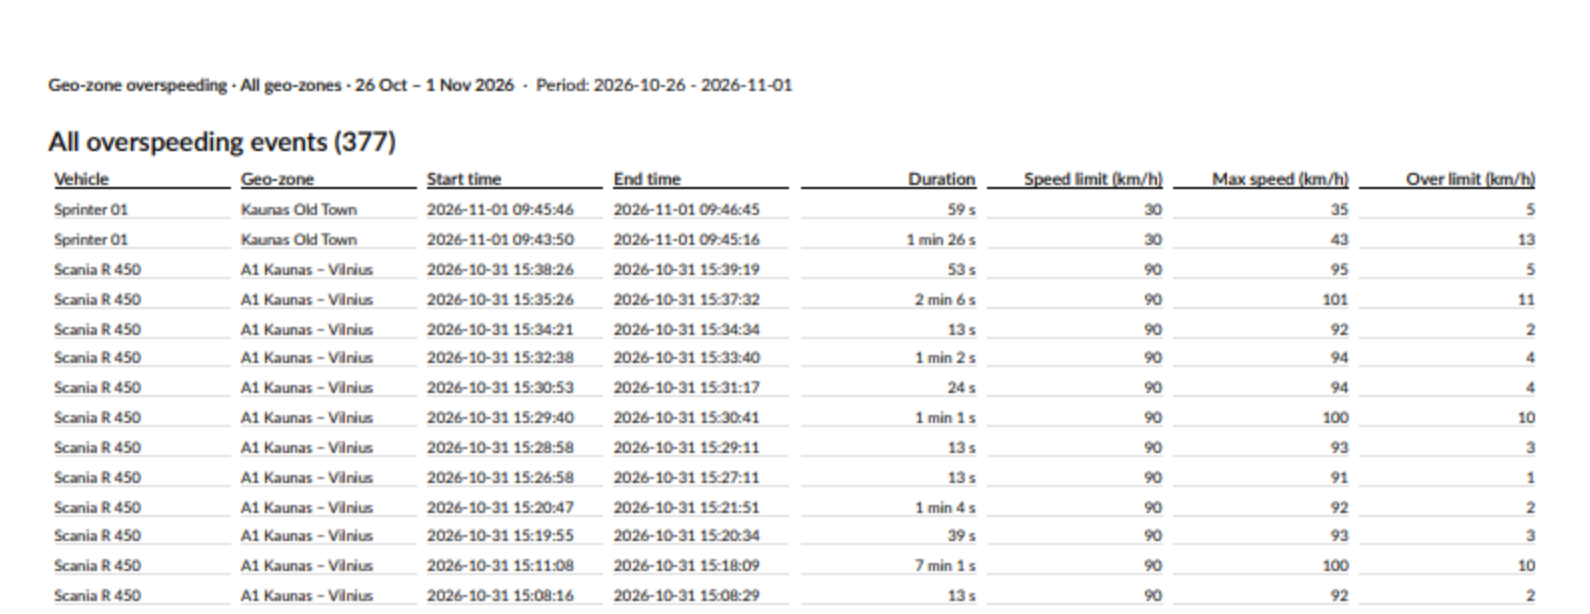
One row is one overspeeding event: one vehicle driving above the limit of one geo-zone, from the moment it went too fast until it slowed down or left the geo-zone.
Only geo-zones that are switched on and have a Max speed are checked. Set the speed limit on the geo-zone, see Geo-zones. Other geo-zones are skipped, even when you tick them in the Data step.
An event belongs to the period it started in. An event that was already going on when the period started is left out. An event that started inside the period is followed until it ends, even after the period.
An event that is still going on when the report is made is Ongoing. It has no end time, and its duration runs until the report was made.
If the tracker sends no data for more than 5 minutes, for example when it loses signal, the event ends there.
When geo-zones overlap, a vehicle can have an event in each of them at the same time, each against its own limit.
Settings
In the Data step, choose the vehicles and the geo-zones. All geo-zones are included at first. The other settings are on the Filters step.
Overspeeding detection
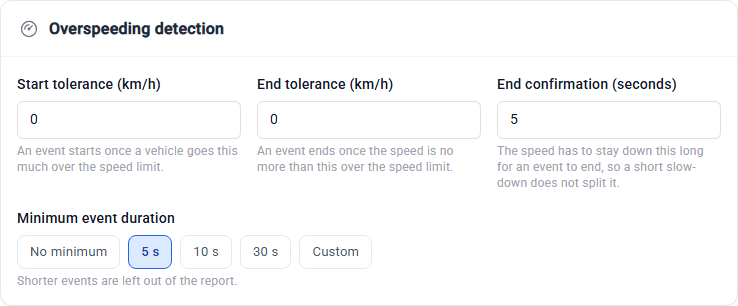
Start tolerance (km/h) – how far over the limit a vehicle must go before an event starts, so driving just over the limit is not reported. With
0, an event starts at 1 km/h over the limit. With5in a 50 km/h geo-zone, an event starts above 55 km/h.End tolerance (km/h) – the event ends when the speed drops to no more than this over the limit. Keep it lower than the start tolerance, so a vehicle driving right around the limit makes one event instead of many short ones. It cannot be higher than the start tolerance. A negative number means the vehicle must drop below the limit.
End confirmation (seconds) – how long the speed must stay down before the event ends, so a short slow-down, for example at a crossing, does not split one event into two. At first
5. If your trackers report less often, for example every 30 seconds, set it to at least that. Otherwise a single slower reading ends the event. The report notes call this setting Hysteresis (s).Minimum event duration – leave out events shorter than 5 s (the default), 10 s, 30 s or a Custom number of seconds, so a brief speed-up, for example while overtaking, is not reported. Choose No minimum to keep every event.
Overspeeding settings
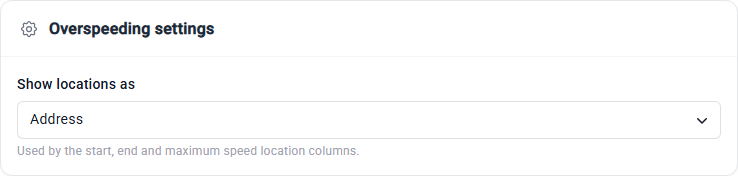
Show locations as – how the Start location, End location and Maximum speed location columns are written: Address (the coordinates when there is no address), Coordinates or Address and coordinates.
Overspeeding filters
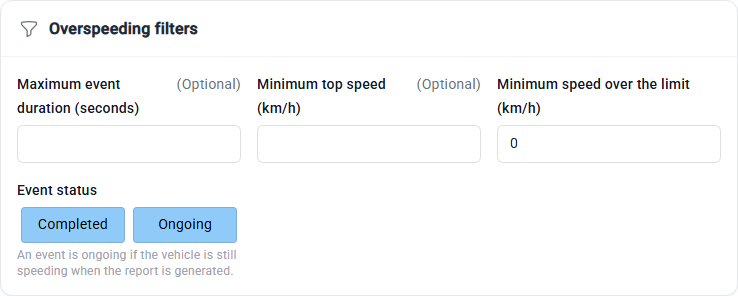
Maximum event duration (seconds) – leave out events longer than this. Empty at first.
Minimum top speed (km/h) – only keep events where the vehicle reached at least this speed. Empty at first.
Minimum speed over the limit (km/h) – only keep events where the top speed was at least this much over the limit, for example
20.0keeps all.Event status – keep Completed events, Ongoing events or both.
The notes at the top of the report say how many events the filters left out.
Event order
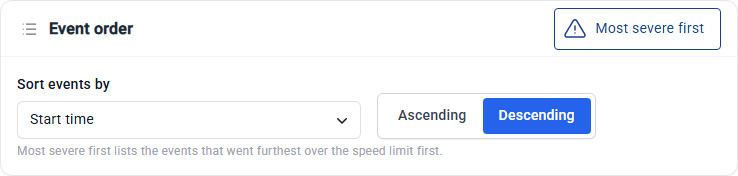
Sort events by Start time, Vehicle name, Geo-zone name, Duration, Speed limit, Max speed or Speed exceeded by, Ascending or Descending. The newest event comes first at the start.
Click Most severe first to list the events that went furthest over the limit first.
Columns
Columns marked ✓ are in the report by default. The vehicle columns and the geo-zone columns can be added too.
Column |
What it shows |
Default |
|---|---|---|
Start time |
✓ |
|
End time |
When the event ended. Empty while ongoing. |
✓ |
Duration |
How long the vehicle was over the limit |
✓ |
Speed limit (km/h) |
The Max speed of the geo-zone |
✓ |
Max speed (km/h) |
The highest speed during the event |
✓ |
Over limit (km/h) |
How far the highest speed was over the limit |
✓ |
Start location and Start coordinates |
Where the event started |
|
End location and End coordinates |
Where the event ended. Empty while ongoing. |
|
Maximum speed location and Max speed coordinates |
Where the highest speed was recorded |
|
Average speed (km/h) |
The average speed during the event |
|
Average speed over limit (km/h) |
How far the average speed was over the limit |
|
Geo-zone entry time and Entry speed (km/h) |
When and how fast the vehicle entered the geo-zone |
|
Geo-zone exit time and Exit speed (km/h) |
When and how fast the vehicle left the geo-zone |
|
Distance while overspeeding (km) |
How far the vehicle drove while over the limit |
|
Trip ID |
The trip the event happened on, to find it in a trips report |
|
Event status |
|
Summary
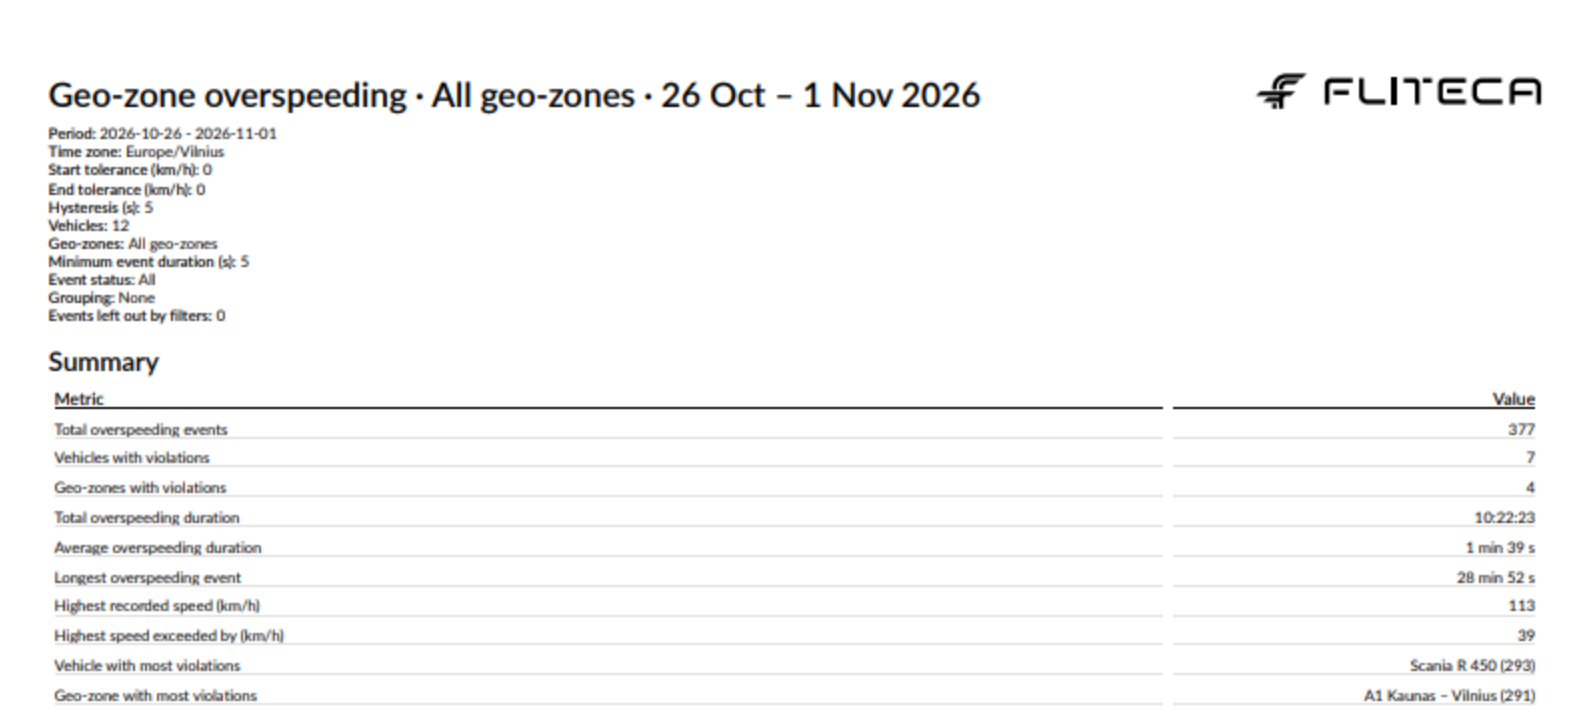
Every geo-zone overspeeding report starts with these figures:
Figure |
What it is |
|---|---|
Total overspeeding events |
The number of events |
Vehicles with violations and Geo-zones with violations |
|
Total overspeeding duration, Average overspeeding duration and Longest overspeeding event |
The time spent over the limit. Ongoing events count until the end of the period. |
Highest recorded speed (km/h) |
The highest speed of all events |
Highest speed exceeded by (km/h) |
The most any vehicle went over a limit |
Vehicle with most violations and Geo-zone with most violations |
The name, with the number of events in brackets |
Summary tables can have a row for each Vehicle, Vehicle group or Geo-zone, split by the day, week or month the event started. They show Events, Vehicles, Geo-zones, Total duration, Average duration, Max speed (km/h) and Max over limit (km/h). See the Summary step.
Example
A geo-zone overspeeding report for one week, with the default settings. Click a picture to see it full size.
Good to know
A geo-zone without Max speed never has events. Check the speed limits of your geo-zones first.
If you change a geo-zone’s shape or speed limit, a report made later for an earlier period uses the new values.
Geo-zone exit time here and Exit time in the geo-zone visits report can differ by a few seconds. Both are right: one is the first moment the vehicle was seen outside, the other the last moment it was seen inside.