Daily activity report
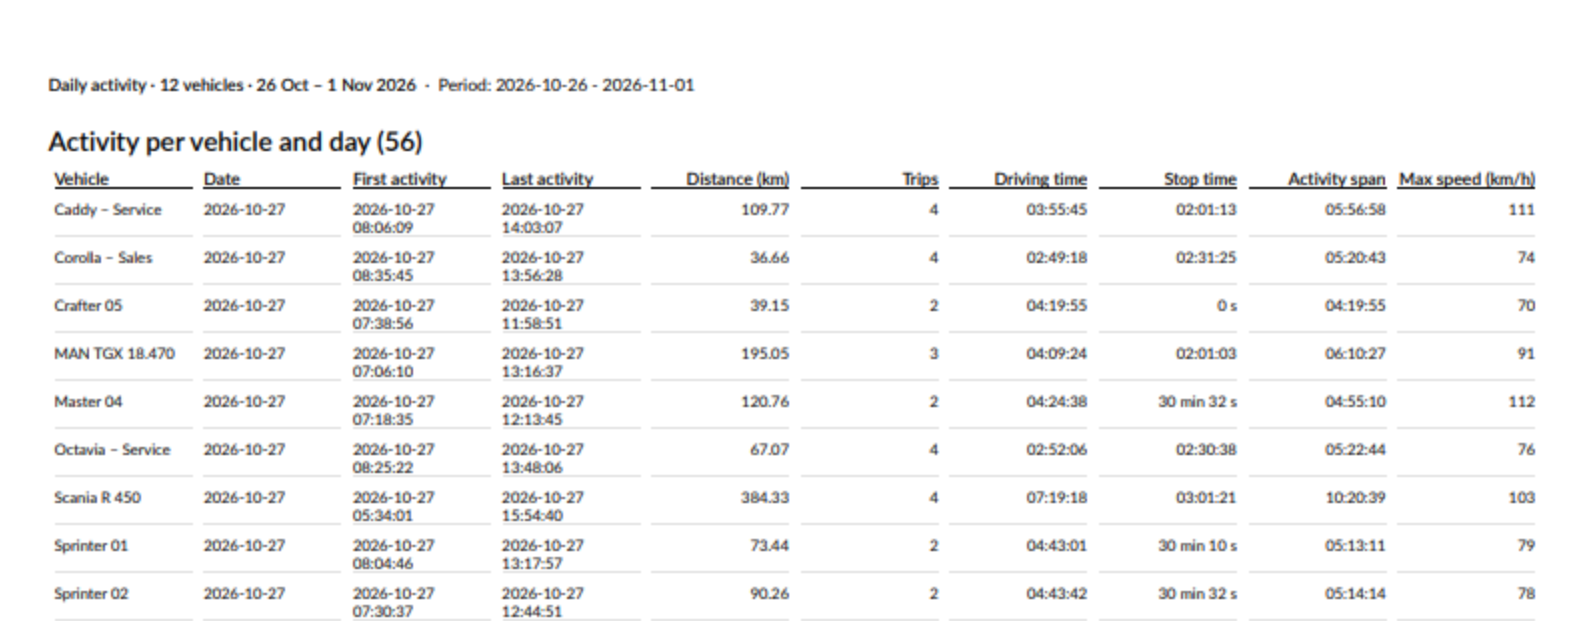
The daily activity report shows what every vehicle did on every day: when it started and finished, how far it drove, how many trips it made and how long it drove.
Use it to see a vehicle’s working day at a glance, or to compare the days of one week.
What is in the report
One row is one vehicle on one day.
The report covers whole days in the report’s time zone. You pick dates, not times, in the When step. Days that have not started yet when the report is made are left out.
A trip counts on the day it started, in full. A trip from 23:30 to 01:15 counts on the first day, and its last activity is on the next date.
Each day has a status:
Active– the vehicle made at least one trip that day.Ongoing– the day’s last trip is still going on when the report is made. Usually only today.Inactive– the vehicle made no trip that day.
Inactive days are left out at first. Tick Inactive under Day status to see them.
Settings
The daily activity settings are on the Filters step.
Daily activity settings

Show locations as – how the First location and Last location columns are written: Address (the coordinates when there is no address), Coordinates or Address and coordinates.
Daily activity filters
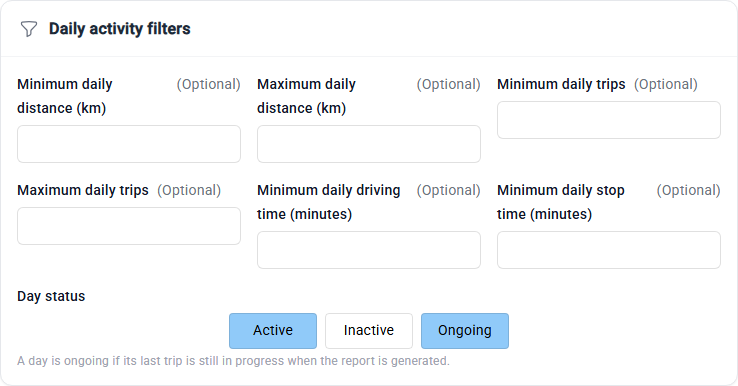
Every filter looks at one vehicle on one day. All of them are empty at first, except Day status.
Minimum daily distance (km) and Maximum daily distance (km) – only keep days with a distance in this range.
Minimum daily trips and Maximum daily trips – only keep days with this many trips.
Minimum daily driving time (minutes) – leave out days with less driving.
Minimum daily stop time (minutes) – leave out days with less Stop time.
Day status – keep Active, Inactive and Ongoing days. Active and Ongoing are ticked at first.
An inactive day has no distance, trips or driving time, so any minimum also leaves the inactive days out. The notes at the top of the report say how many days the filters left out. By default this includes every inactive day.
Day order

Sort days by Date, Vehicle name, Distance, Trips or Driving time, Ascending or Descending. The oldest day comes first at the start.
Columns
Columns marked ✓ are in the report by default. The vehicle columns can be added too.
Column |
What it shows |
Default |
|---|---|---|
Date |
The day the row covers |
✓ |
First activity |
When the first trip of the day started |
✓ |
Last activity |
When the last trip of the day ended, or the time the report was made while it is still going on |
✓ |
Distance (km) |
How far the vehicle drove on the day’s finished trips |
✓ |
Trips |
The number of trips that started that day |
✓ |
Driving time |
The time spent on the day’s trips. A trip still going on counts until the end of the day or until the report was made. |
✓ |
Stop time |
The time the vehicle stood parked during its working day, between the first and the last trip |
✓ |
Activity span |
How long the working day was: from the start of the first trip to the end of the last one |
✓ |
Max speed (km/h) |
The highest speed of the day |
✓ |
Engine idle time |
The time the vehicle stood still with the engine running. Waits shorter than 3 minutes, such as at traffic lights, are not counted. |
|
Average speed (km/h) |
The average speed while driving that day |
|
Average trip distance (km) and Max trip distance (km) |
The average and the longest distance of one trip |
|
Average trip duration and Max trip duration |
The average and the longest duration of one trip |
|
First location |
Where the first trip of the day started |
|
Last location |
Where the last trip of the day ended. Empty while it is still going on. |
|
Day status |
|
On an inactive day, the distance, trips, driving time and stop time are 0 and the other columns are empty.
Summary
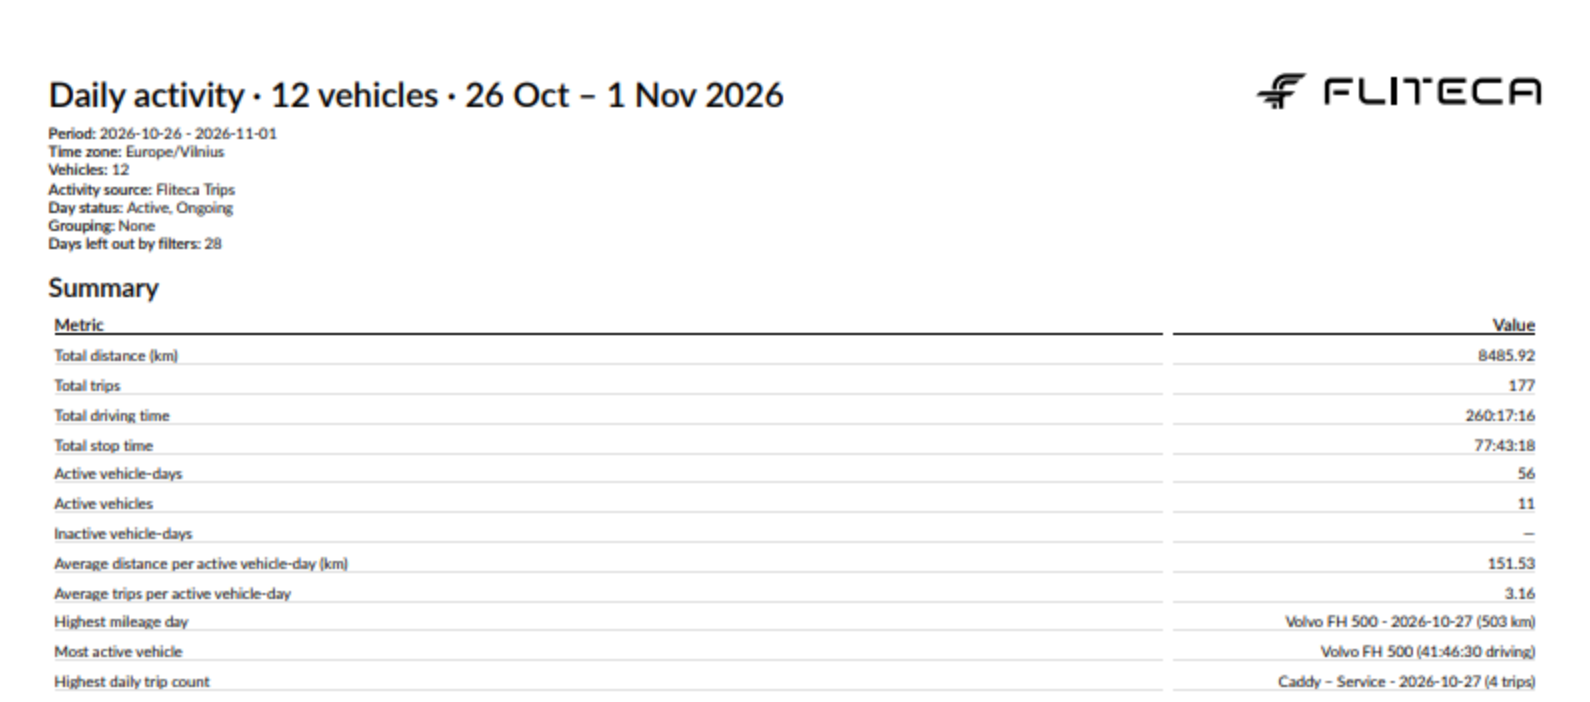
Every daily activity report starts with these figures. They count only the days that are in the report.
Figure |
What it is |
|---|---|
Total distance (km), Total trips, Total driving time and Total stop time |
The sums of all days |
Active vehicle-days |
The number of active and ongoing days. Two vehicles that both drove on Monday make 2 vehicle-days. |
Active vehicles |
The number of vehicles with at least one active day |
Inactive vehicle-days |
The number of inactive days. Only filled when Inactive is ticked. |
Average distance per active vehicle-day (km) and Average trips per active vehicle-day |
How far and how many trips a vehicle made on average on a day it was used |
Highest mileage day |
The vehicle and the day with the longest distance, for example |
Most active vehicle |
The vehicle with the most driving time, for example |
Highest daily trip count |
The vehicle and the day with the most trips, for example |
Summary tables can have a row for each Vehicle or Vehicle group, split by day, week or month. They show Vehicles, Active days, Distance (km), Trips, Driving time and Stop time. Every row of the list already is a vehicle on a day, so a row for each vehicle split by day adds no table. See the Summary step.
Example
A daily activity report for one week, with the default settings. Click a picture to see it full size.
Good to know
To see the days a vehicle stood still, tick Inactive under Day status and leave the minimums empty.
A trip that runs past midnight counts on the day it started. The next day can be Inactive although the vehicle was still driving.
To see one row for the whole period for each vehicle, use the mileage report instead.