Trips report
The trips report lists every trip your vehicles made: when and where each one started and ended, how far it went and how fast. It also lists the time between trips, when the vehicle was parked.
Use it to check where a vehicle went on a certain day, or to find the trips that started at the depot and ended at a customer.
What is in the report
One row is one trip, or one stretch between trips. The Type column tells them apart:
A row belongs to the period it started in and is shown in full, even if it ended later. A trip that started before the period is left out, even if it ended inside it. This way reports for back-to-back periods never list the same trip twice.
A row that has not ended when the report is made is Ongoing. It has no end time and no distance yet, and its duration runs until the report was made. This is usually the vehicle’s current trip or parking.
Vehicles without trips in the period have no rows.
Settings
The trips settings are on the Filters step.
Trip settings
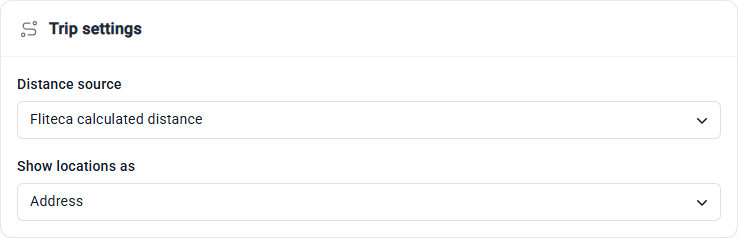
Distance source – where the distances come from. For now the only choice is Fliteca calculated distance: the length of the route the tracker recorded.
Show locations as – how the Start location and End location columns are written:
Address – the street address, or the coordinates when there is no address
Coordinates – latitude and longitude, for example
54.89412, 23.92381Address and coordinates – both, for example
Pramonės pr. 16B, Kaunas (54.89412, 23.92381)
Trip filters
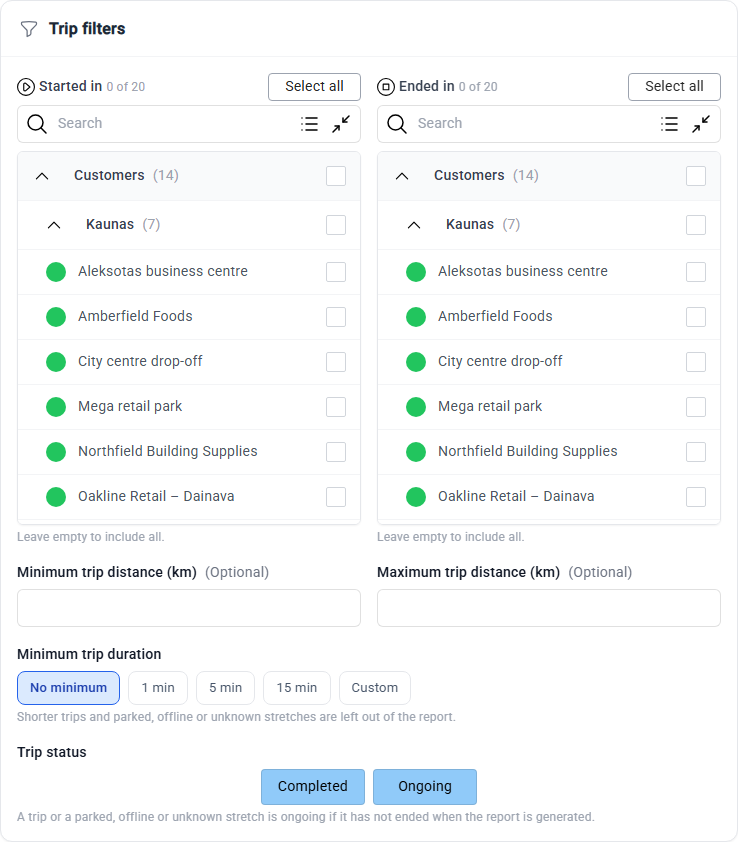
All filters are empty at first, so every row is kept.
Started in – only keep rows that started inside one of the ticked geo-zones. Leave it empty to keep rows that started anywhere. Tick a geo-zone group to include the geo-zones added to it later.
Ended in – the same for where the row ended. Ongoing rows have not ended, so this filter leaves them out.
Minimum trip distance (km) and Maximum trip distance (km) – only keep rows with a distance in this range. Ongoing rows have no distance yet, so either value leaves them out.
Minimum trip duration – leave out rows shorter than 1 min, 5 min, 15 min or a Custom number of minutes. This also removes short parked stretches.
Trip status – keep Completed rows, Ongoing rows or both.
Started in and Ended in are only shown when your plan includes geo-zones and you may see them. The notes at the top of the report say how many rows the filters left out.
Trip order
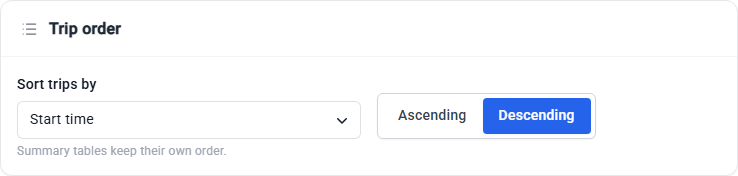
Sort trips by Start time, Vehicle name, Duration or Distance, Ascending or Descending. The newest trip comes first at the start.
Columns
Columns marked ✓ are in the report by default. The vehicle columns can be added too.
Column |
What it shows |
Default |
|---|---|---|
Type |
|
✓ |
Start time |
When the row started |
✓ |
Start location |
Where it started, as set in Show locations as |
✓ |
Start coordinates |
Latitude and longitude where it started |
|
End time |
When it ended. Empty while ongoing. |
✓ |
End location |
Where it ended. Empty while ongoing. |
✓ |
End coordinates |
Latitude and longitude where it ended |
|
Distance (km) |
How far the vehicle went. Empty while ongoing. |
✓ |
Trip duration |
From the start to the end, or until the report was made while ongoing |
✓ |
Max speed (km/h) |
The highest speed recorded |
✓ |
Average speed (km/h) |
The average over the whole trip, including the time standing still in traffic |
|
Average moving speed (km/h) |
The average while the vehicle was moving, without the time standing still. It shows how fast the vehicle was driven. |
|
Moving time |
The time the vehicle was moving |
|
Engine idle time |
The time it stood still with the engine running. Waits shorter than 3 minutes, such as at traffic lights, are not counted. |
|
Idle stops |
How many times it stood still with the engine running for 3 minutes or more |
|
Trip status |
|
|
Trip |
The name of the trip in Fliteca, for example |
|
Trip ID |
A code that identifies the trip, to find the same trip in other reports and exports |
|
Track points |
How many positions the tracker recorded on the trip. With few positions the route and the distance are less exact. |
Average moving speed, Moving time, Engine idle time and Idle stops are only filled for finished trips.
Summary
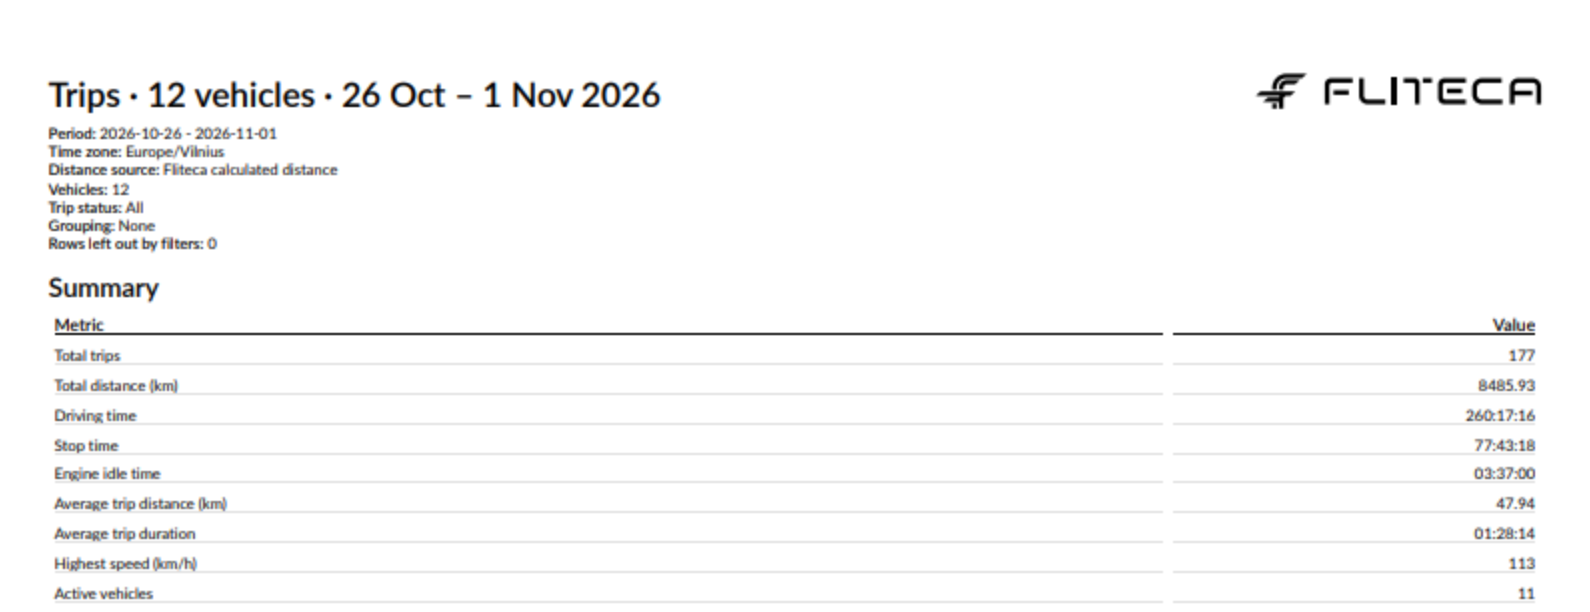
Every trips report starts with these figures:
Figure |
What it is |
|---|---|
Total trips |
The number of trips. Parked and offline rows are not counted. |
Total distance (km) |
The distance of all rows |
Driving time |
The time spent on trips. An ongoing trip counts until the end of the period. |
Stop time |
The time the vehicles stood parked during their working days, between the first and the last trip of each day. Nights and days off are not counted. |
Engine idle time |
The idle time of all trips |
Average trip distance (km) |
The total distance divided by the number of trips |
Average trip duration |
The driving time divided by the number of trips |
Highest speed (km/h) |
The highest speed in the report |
Active vehicles |
The number of vehicles with at least one row |
Summary tables can have a row for each Vehicle or Vehicle group, split by the day, week or month the trip started. They show Trips, Vehicles, Distance (km), Driving time, Average trip duration, Longest trip and Stop time. See the Summary step.
Example
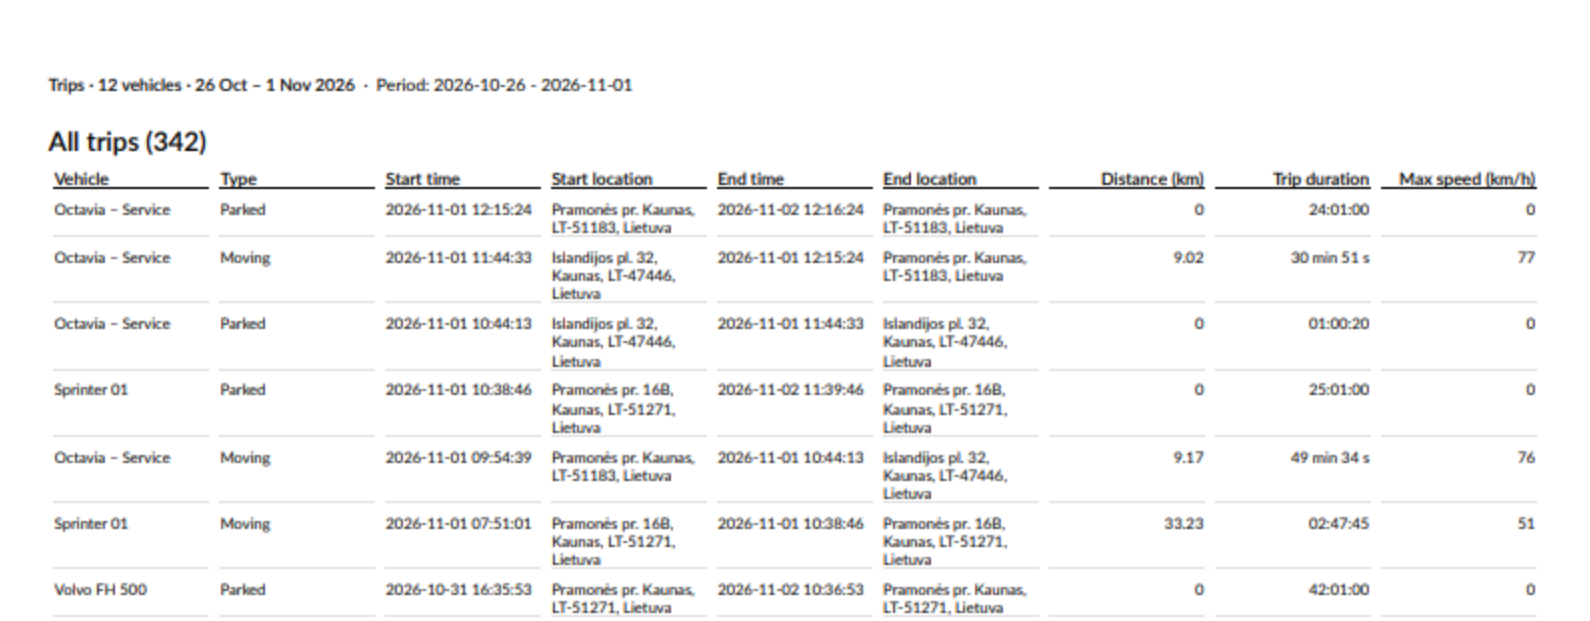
A trips report for one week, with the default settings. Click a picture to see it full size.
Good to know
To see only the trips, download the report as XLSX and filter the Type column on
Moving.The list title counts all rows, for example All trips (342), while Total trips counts only the
Movingrows.A parked stretch that started inside the period shows its full length, even when it lasted over the weekend.